first published : 02.11.2020
data and text updated: 15.01.2021
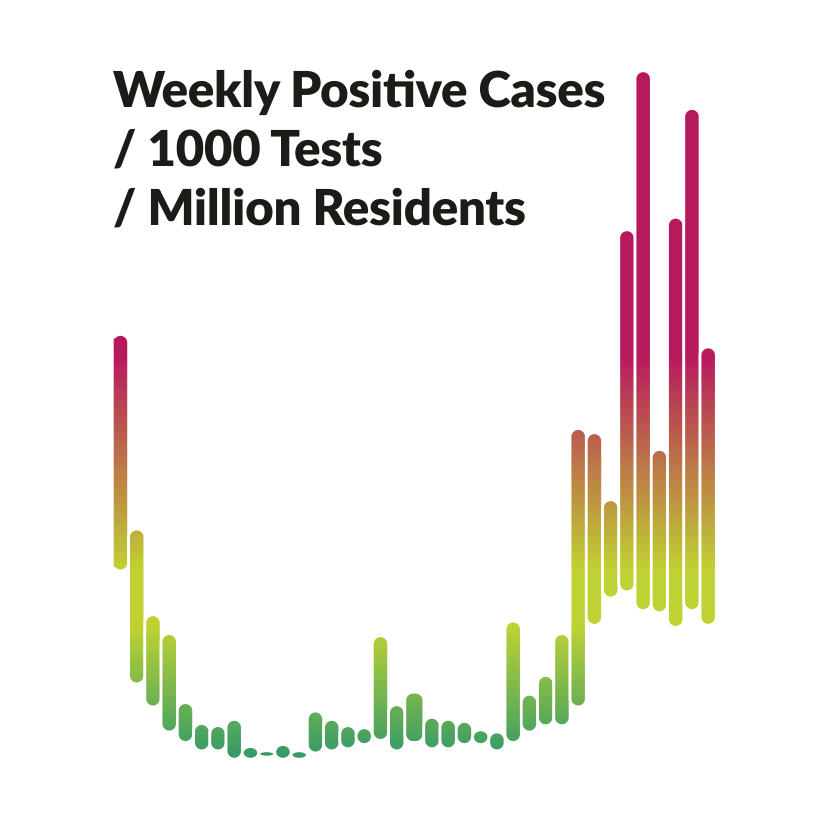
Since the beginning of SARS-CoV-2/ COVID-19 pandemic, the ‘daily’ number of PCR tests performed were adapted to the needs of the situation and therefore for visual comparison, could be normalized to the resident population (per Million residents considered here). But the number of PCR tests themselves do not offer insights into the pandemic, and it is the number of ‘positive tests’. So a second round of normalization is needed (positive tests per 1,000 PCR tests considered here), and hence our x-axis is ‘Weekly Positive Cases Per 1000 Tests Per Million Residents‘. For discussion purposes (below) we call the this measure as ‘normalized positivity rates‘.
Next to visualize how the hospitalizations have changed over the weeks and if there is any correlation with the ‘normalized positivity rates‘, as earlier, we normalized the total hospitalized patients with the number of residents (per Million residents considered here). For discussion purposes, we would call this measure as ‘normalized hospitalization rates‘
Obervation: The increase in ‘normalized hospitalization rates‘ takes place about 2-3 weeks after the initial increase in ‘normalized positivity rates‘ but the decrease in hospitalizations is a much slower process and extends several weeks!
Also, even a relatively small increase in ‘normalized positivity rate‘ has a significant effect on the ‘normalized hospitalization rates‘. For example, a small increase in positivity rates started in the week (22.06-28.06) had an immediate and strong effect on hospitalization rates (peaked during (27.07-02.08)).
data source: data.public.lu
