This is a OPINION PIECE and should be interpreted with CAUTION!
The text is ‘overtly simplified’ for general audience and DOES NOT CLAIM scientific accuracy but is only intended to present easy to understand information.
Context: The ‘effective reproduction number’, commonly known as Rt, is an indicator for the ‘the average number of new infections caused by a single infected individual at time t in the partially susceptible population‘ (source wikipedia). It is often mentioned in press, media and official reports/ communique in the context of ongoing SARS-CoV-2 coronavirus pandemic and has gained strong attention in public-opnions as well as help guide decisions/ measures taken by the policymakers.
Information: It is interesting to note that Rt is not a constant and common opinion holds that Rt values <1 is to be interpreted as the ‘infection rates are decreasing’ and hence the current situation is better than the past days or weeks.
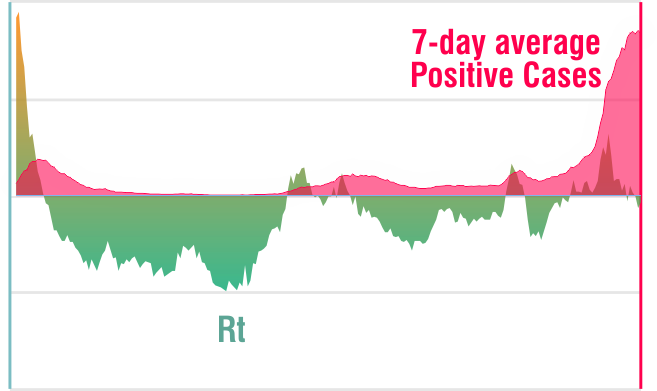
Data: To see how Rt values (Rt_eff) correlate to the changes in number of new infections (7-day moving average), the data was plotted overlapping with Rt=1 (left y-axis) being equivalized to 7-day average positive cases=0, for comparison purposes.
Observations: (a) Early data from March 2020 show high Rt values (>1.5) are followed by high positive cases detected (up to 150)
(b) April – June 2020 had Rt values <1 and followed by very low cases (less than 10)
(c) In July 2020 and again in September 2020, the Rt values peaked over 1 (for small periods) which is also followed by higher cases and finally again,
(d) in Oct 2020, the Rt values breached 1.5 mark and is followed by higher cases, but in this instance the case loads were up above 600 cases (7-day averages)
Outcomes: There are two main interpretations from the above charts. First, while Rt values <1 shows ‘infection slowdown’, the actual number of daily cases decrease much slowly (spread over several weeks) and hence Rt values <1 probably offers a ‘false’ sense of immediacy in the improvement of the situation. It is therefore recommended to emphasize that the Rt values from 1 to 0.25 as ‘improved but cautious’ state and only below 0.25 as ‘improved’ situation.
The second interpretation is that Rt values does not correlate with the ‘volume’ of cases but only with the ‘rise’ or ‘fall’ in cases, and hence probably to be treated as a secondary indicator with overall less ‘weightage’ for policymakers while deciding on public ‘measures’ or guidances.
first published : 07.11.2020


