Early on in the SARS-CoV-2 pandemic it was noted that males are more affected than the females, noticably in the severity of the disease, for example, higher crude death rates. Now that COVID-19 vaccines are available for nearly 6-months and millions of doses have been administered world-wide, first data are available in terms of levels of vaccine induced antibodies in males versus females.
DISCLAIMER: The current article and its text is NEITHER endrosed by the authors of the original publication NOR reflect their opinion in any way. The text below is an interpretation of a subset of data and p-values of the Wilcoxon test in male versus female datasets.
Additionally, the text here is over-simplified for general readers and only intended to be informational. Please consult the original publication and data details for proper assessment.
The following data is a subset of live-virus SARS-CoV-2 neutralisation assays from 160 participants from UK (60 males, 100 females, median age 42 years) following the Pfizer-BioNTech vaccination (both doses) against four SARS-CoV-2 strains, the original spike sequence (Wild-type) and three ‘Variants of Concern (VoC)’, Alpha (B.1.1.7, first detected in the UK), Beta (B.1.351, first detected South Africa) and Delta (B.1.617.2, first detected in India). The analysis (methods section) and how to interpret the chart is given below.
Briefly, the data shows that the median values of the Pfizer-BioNTech induced SARS-CoV-2 spike protein antibodies in the neutralizing assays are marginally higher in females than males in all four SARS-CoV-2 strains (namely the wild-type, Alpha, Beta and Delta). Please note that the Y-axis is exponential scale (power 2, for better visualization purposes) and although the medians ‘appear closer’, the values differ significantly (up to 5 times, median values are shown in table below)
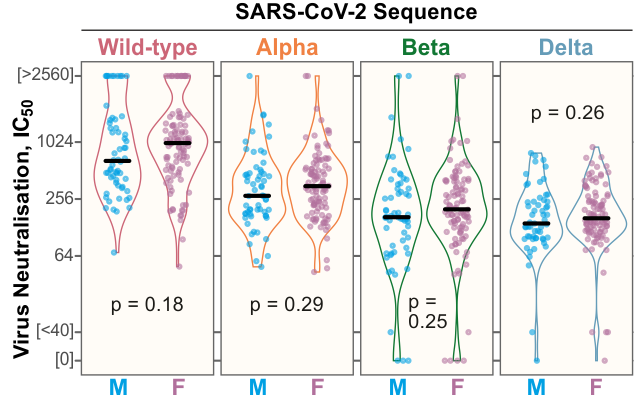
It is to be noted that the difference is NOT statistically significant (see the how to read the graph (data)). Moreover, the neutralizing antibodies decreased in all three VoCs (Alpha, Beta and Delta) compared to wild-type (the Y-axis values representing Virus neutralization IC50 values, especially the values above 2560 decreased in Alpha and Beta, and none in Delta varaint!), probably showing the lower vaccine-efficacy against the VoCs. Also, the p-values (difference between the male and females) decreased in VoCs (p-values 0.29, 0.25 and 0.26, respectively, compared to 0.18 in wild-type). In other words, the vaccine-induced antibodies have less effect on the VoCs and the difference between the male and female decreased too.
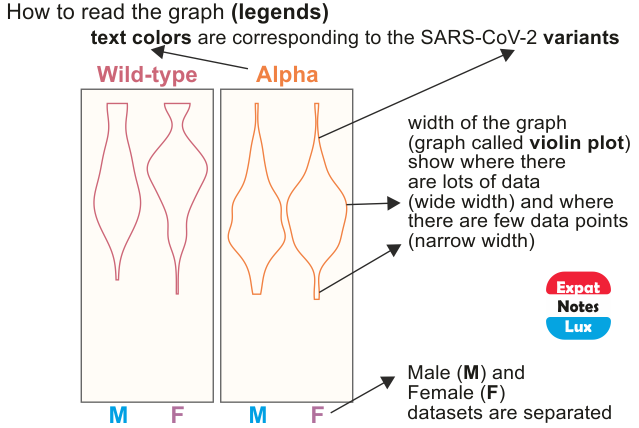
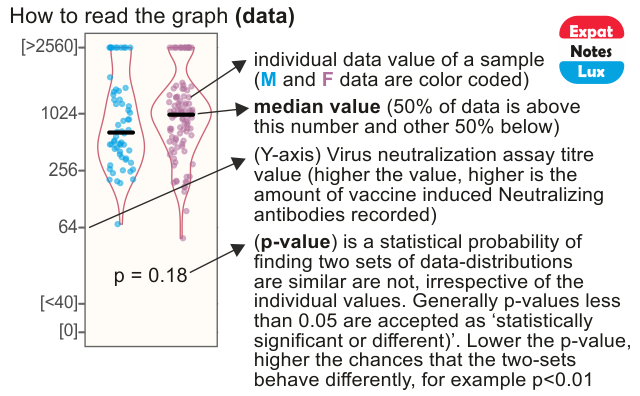
Table for the median values shown in the graph above
| Median IC50 (Male) | Median IC50 (Female) | |
|---|---|---|
| Wild-type | 647 | 999 |
| Alpha | 277 | 350 |
| Beta | 164 | 199 |
| Delta | 141 | 160 |
Methods: The above data is from the publication in The LANCET, titled ‘Neutralising antibody activity against SARS-CoV-2 VOCs B.1.617.2 and B.1.351 by BNT162b2 vaccination‘, published 19.06.2021 (PDF file, 298kb). The anonymized data and the code in R script for graphs in the publication is available on github and were used to custom generate the above graphs shown above. A similar graph is available in the original publication, Supplementary figure 2A (on page 4 of PDF file, 4.2Mb).
Sample: Briefly, the participants were first sampled at ~3 weeks post-vaccination and followed again at 6 and 12 weeks time, with blood samples collected for serological assays including anti-spike IgG, IgM and live-virus neutralisation assay. The IC50 values represent the fold-dilution of blood-serum required to inhibit 50% of viral replication in the live-virus SARS-CoV-2 neutralisation assay.