‘Viral shedding‘ of SARS-CoV-2 coronavirus from an infected person is mostly discussed in terms of ‘respiratory shedding’ but ‘gastrointestinal shedding’ it is also known from SARS and is true for SARS-CoV-2 as well. Basically, it means that the viral RNA can be detected in the ‘faecal samples’ when collected directly from an infected person or indirectly from the ‘sewage’. This is quite interesting because it gives the possibility to look at small-communites over time and see how much ‘viral load‘ it has compared to other regions. If this ‘sewage-origin’ data can be compared with actual number of cases (from testing each person or knowing the number of people admitted to hospital from a community over a time period), it is theoretically possible to ‘forecast’ the number of cases by just looking at the ‘sewage containing wastewater treatment plants’ data (if enough data points are available).
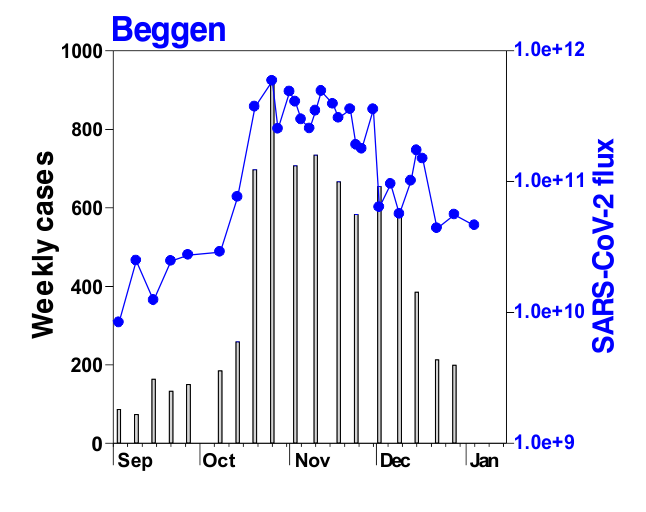
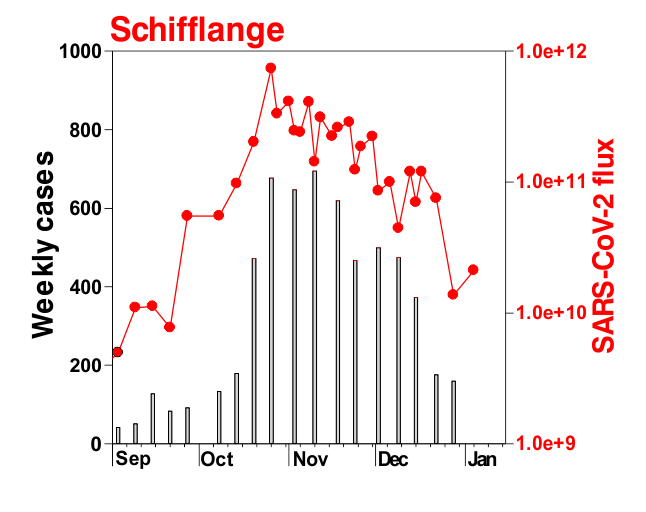
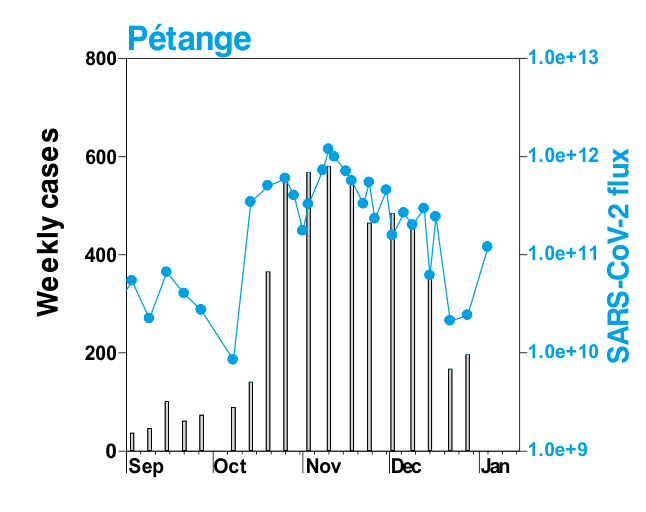
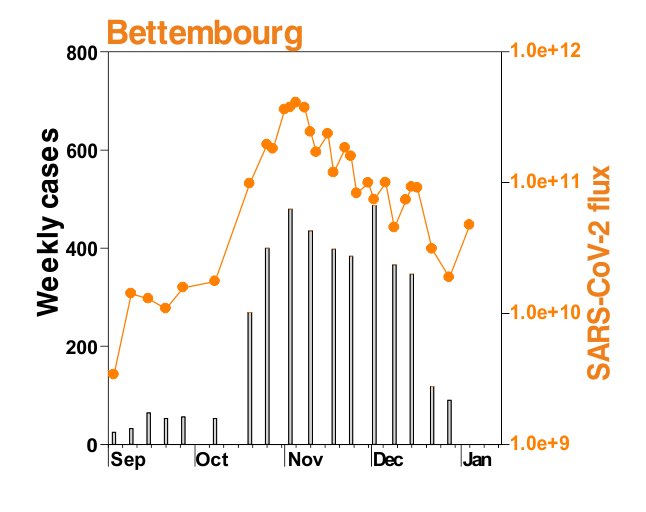
This is mostly what the researchers from LIST intended from CORONASTEP project to find, and although not yet been successful to make a good correlation of the amount of viral RNA found in the wastewater treament plants across Luxembourg with the number of positive cases (normalized to the population for each sewage/wastewater treatment grid), but are currently working with mathematicians and modellers to deduce such correlation. Nevertheless, there has been visible correlation between the ‘flux’ (viral load) in ‘sewage containing wastewater’ and the number of positive cases detected (graphs below). The data shown below is from four largest wastewater-treatment plants in Luxembourg (please read the full report here).
ALL CHARTS BELOW ARE ADAPTED FROM CORONASTEP REPORT 38 – dated 06.01.2021
Flux = RNA copies / day / 10,000 inhabitants
The above data / charts are also regularly shared on the weekly update on the Ministry of Health webpage .
first published : 29.10.2020
lastest update: 08.01.2021