first published : 28.11.2020
data updated: 30.09.2021
Context: The SARS-CoV-2 pandemic is already under ‘fourth wave’ in Europe and has witnessed sudden increase or decrease in cases across different age-groups and regions over the course of last 18 months. Luxembourg is geographically small and can be grouped by age to follow the rise and fall of SARS-CoV-2 cases, and since age-groups are inter-connected, we may find a ‘chain-of-infections’ as a pattern. In principle, we might visualize if an age-group is more vulnerable at one point of time compared to others and with the changing scenarios (like vaccination update and ‘Variants of Concern’).
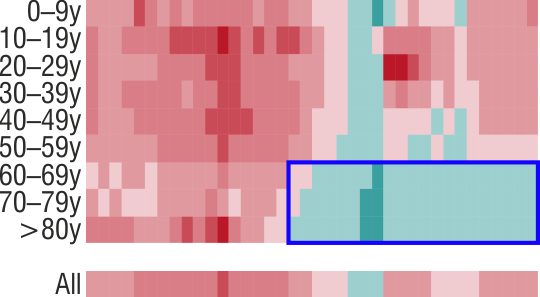
Data: Here we considered the weekly SARS-CoV-2 positive cases (Mon-Sun) across Luxembourg resident population since Jan 2021 and because the ‘age-groups’ are of different ‘size’ (number of people in each age-group), we normalized the cases by per 1,000 residents in each age-group for comparison purposes.
Assumptions: Before the observations are presented, please note that certain assumptions are necessary but may not be 100% accurate. First assumption would be that every week the number of tests done are evenly distributed (pro-rata) amongst all age-groups. While, if the number of tests in each groups is available, then we could have normalized the number of tests and had a more accurate assumption but without this data, we have to assume that the tests were evenly distributed amongst the age-groups. A second assumption would be that each age-group primarily ‘socializes’ with the same age group. Without this assumption, it would be hard to follow the chain within the same age-group and which slowly progresses to other age-groups. Both these assumptions are critical for the abservations below and the limitations are acknowledged.
Observations: With the COVID-19 vaccinations available to elders early on (since Jan 2021) and hygiene measures at place, we can see below since May 2021, the number of new cases every week has dropped below 1 per 1,000 residents of age 60y or older. This is probably a direct and convincing visualization of vaccine effectiveness in Luxembourg
If you are using a smartphone or a small-display, please rotate the device to ‘landscape view’ for better visualization
This is a OPINION PIECE and should be interpreted with CAUTION!
The text is ‘overtly simplified’ for general audience and DOES NOT CLAIM scientific accuracy but is only intended to present easy to understand information.
data source: data.public.lu
